Falling exports: Ukraine’s foreign trade in the second year of war
Ukrainian trade collapsed in 2022 due to the war (see ‘A year of war in Ukraine's foreign trade’), but it stabilised to a certain extent in 2023. During that time, exports decreased by nearly 20%. The reason for this was lower grain prices (this being one of Ukraine’s main exports) on the world markets, rather than lower sales volume. If the new maritime corridor, launched in August 2023 from the so-called ‘great Odesa’ ports, continues to operate, foreign sales may rise in the coming months. However, a return to pre-war levels of trade will only be possible when the hostilities end.
Lower exports
In 2023, Ukraine’s foreign sales stood at $36.2 billion, which was 18.1% ($8 billion) less than a year earlier. This substantial reduction in exports can be attributed primarily to the decrease in the prices of Ukrainian products, as the sales volume increased by 0.6%, from 99.8 million to 100.3 million tonnes.
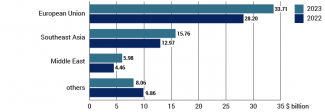
As in 2022, the European Union continued to be the primary destination, accounting for 65.6% of Ukrainian exports, followed by the Middle East (13.8%) and Southeast Asia (10.5%).
Chart 1. Exports of goods by region in 2022 and 2023
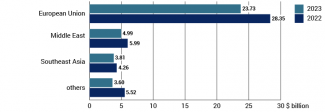
Source: State Customs Service of Ukraine.
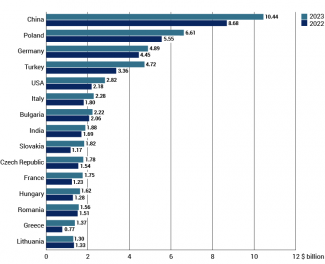
Poland continued to be the primary destination for Ukrainian goods worldwide, despite a 28.6% drop in imports from $6.7 billion in 2022 to $4.8 billion in 2023. This decline was primarily due to the ban on the sale of specific types of grains and oilseeds introduced last April. The protest by Polish carriers at the border, which began on 6 November 2023, also contributed to the decrease in Ukrainian sales to Poland, as these significantly obstructed the flow of goods.
Exports to other neighbouring EU countries and Bulgaria also fell, as they also reduced their imports of agricultural products from Ukraine. Romania was an exception among these countries, as it offset the ban by increasing purchases of Ukrainian sunflower oil.
Chart 2. 15 largest recipients of Ukrainian goods in 2022 and 2023
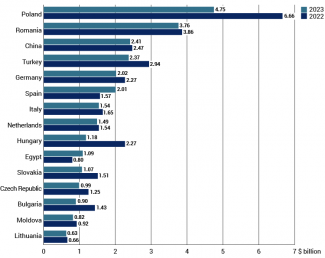
Source: State Customs Service of Ukraine.
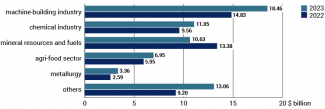
The commodity structure of Ukrainian exports in 2023 did not change significantly compared to the previous year. The agri-food sector maintained its dominant position, accounting for 60.8% of foreign sales. There has been a continued decline in the importance of metallurgical production (-35% y/y) and mineral resources (-45.6% y/y) which, along with agricultural products, used to be the most important commodities sold abroad before the war. However, results in this area may improve in the coming months due to the launch of the new Black Sea corridor. In contrast to the Black Sea Grain Initiative, which was in place from August 2022 to July 2023, (see ‘Russia's game with the West: Moscow withdraws from the grain deal’) this enables the export of not only agricultural produce but also metallurgical products and iron ore, which were primarily shipped by sea before the Russian invasion (see ‘Ukraine: the new Black Sea corridor is a success’).
Chart 3. Exports of goods by sector in 2022 and 2023
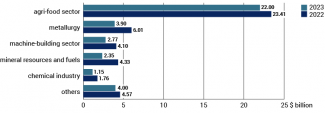
Source: State Customs Service of Ukraine.
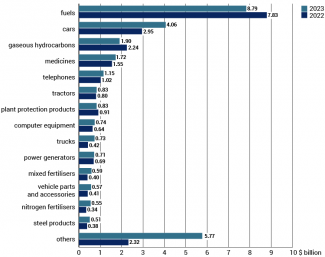
The key export products were still: grain (particularly maize and wheat), oilseeds (soybeans and rapeseed) and sunflower oil. In most categories, the value of exported goods in 2023 was lower than a year earlier. However, this was due to lower prices of agricultural products on the global markets rather than a decrease in foreign sales (for instance, the export volume of maize in 2023 was 1.4 million tonnes higher than in 2022). Maize prices on the Paris exchange (Matif) were over €300 per tonne for most of 2022, but they were continuously falling from November 2022 and throughout 2023, reaching around €200 euros by year end. The same happened with wheat.
Chart 4. 15 most important Ukrainian exports in 2022 and 2023
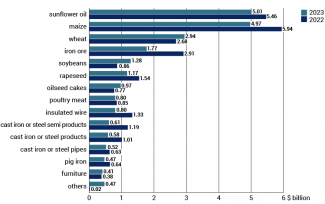
Source: State Customs Service of Ukraine.
Higher imports
Ukrainian imports of goods in 2023 stood at $63.5 billion, which was 14.4% more than in 2022. Over half of the imported products came from the EU (53%). Southeast Asian countries also played an important role.
Chart 5. Imports of goods by region in 2022 and 2023
Source: State Customs Service of Ukraine.
The largest share of imports (16%) came from China. In terms of overall trade, China became Ukraine’s largest trading partner in 2023 and surpassed Poland in this regard.
Chart 6. 15 largest importers to the Ukrainian market in 2022 and 2023
Source: State Customs Service of Ukraine.
Machinery and equipment had the greatest share in imports (29.1%) in 2023. In terms of value, imports increased in all sectors except for the mineral resources and fuels industry. The decline in the latter is primarily due to significant cuts in coal purchases.
Chart 7. Imports by sectors in 2022 and 2023
Source: State Customs Service of Ukraine.
As had been the case the year before, fuels were the main imported goods in 2023 (12.2% of total imports), which was due to Ukraine’s complete dependence on external supplies since the destruction of the country’s only functioning refinery in April 2022. Although the value of fuel imports was 10.9% lower than in 2022, the volume increased from 7.3 to 7.6 million tonnes. The ‘others’ category is noticeably large (nearly 10% of total imports), while before the Russian invasion, it was marginal. It is difficult to determine precisely which goods it includes. However, considering the main countries from which Ukraine imported goods in this category (Bulgaria, Turkey, the Czech Republic and Pakistan), it can be assumed that it reflects supplies related to defence.
Chart 8. 15 most important Ukrainian imports in 2022 and 2023
Source: State Customs Service of Ukraine.
Trade balance problem
In 2023, Ukraine’s foreign trade balance was record-low, as it reached -$27.3 billion. In 2022, Ukraine also had a trade deficit, but it was more than 50% lower (-$11.3 billion). Between July and October 2023, exports of goods were less than half the value of imports.
Chart 9. Monthly trade volume in 2023
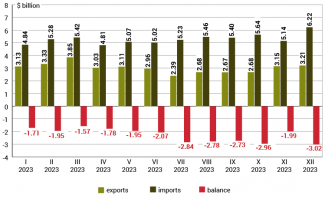
Source: State Customs Service of Ukraine.
Most sectors of the economy experienced a negative trade balance. Only agriculture and the food industry achieved a significant surplus of $15 billion, while the metallurgical industry had a small surplus of just $0.5 billion. In all other branches of trade, imports exceeded exports, especially in the machine-building industry (-$15.7 billion).
In times of peace, this situation would pose a significant challenge to the country’s balance of payments, draining the central bank’s foreign reserves. However, the foreign currency reserves of the National Bank of Ukraine remain at a stable high level ($40.5 billion in December 2023) thanks to consistent support from the West.
Chart 10. Trade balance in 2023 by sectors
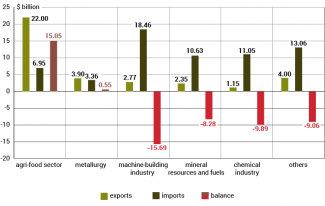
Source: State Customs Service of Ukraine.
Prospects
Nothing suggests that the hostilities will end in the coming months. Therefore, no significant economic recovery in Ukraine and, consequently, substantial increase in its trade should be expected in 2024. Imports will likely remain at a level similar to the previous year, while exports may grow to some extent (government forecasts suggest they could go up to 9%).
Continuing development of the new Black Sea corridor may greatly contribute to increasing foreign sales. This route is more important than the potential resumption of exports of some grains and oilseeds to neighbouring EU countries. Within the corridor, traditional (pre-war) logistics chains are utilised, and there is no need to cross the land border with the EU, which has low capacity and, in the case of railways, requires additional transshipment due to different track gauges.